Searching outside the Council streetlight.
Council support can be unintentionally directed to those they have most contact with; not necessarily the people most in need.


Councils provide a lot of valuable, target support for their residents. Relative to anyone else in Government, they know the most about their residents. However, knowing more than anyone else doesn’t mean you know everything.
Often, Council support can be unintentionally directed to those they have most contact with; not necessarily the people most in need.
It brings to mind a famous joke:
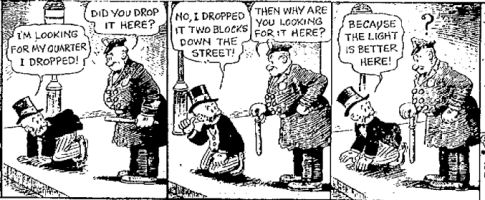
A policeman sees a drunk man searching for something under a streetlight and asks what the drunk has lost. He says he lost his keys and they both look under the streetlight together. After a few minutes the policeman asks if he is sure he lost them here, and the drunk replies, no, and that he lost them in the park. The policeman asks why he is searching here, and the drunk replies, "this is where the light is".
Who’s in the Council streetlight?
Most people have fairly limited interaction with their local Council. It can often be confusing understanding the difference between the County, District or Parish. And the Council boundaries might not align neatly with your perception of where you live. You would probably say that you live in Kentish Town, or that you are a “Londoner”, you are unlikely to say that you are a resident of the London Borough of Camden.
But other people have much more direct and frequent interaction with their Council; they are firmly in the gaze of the streetlight:
People on benefits — most benefits are administered and managed by DWP, but Housing Benefit and Council Tax Benefit are run by Local Councils. Often as part of this application process, Councils will offer further support or signpost towards other programmes.
People with mental health problems, learning or physical disabilities — one of the largest Council responsibilities is clearly supporting these people through Adult Social Care. Those with a case worker through this process naturally have a much higher awareness of other Council programmes that may be available.
Social Housing tenants — there are almost 1.6 million homes owned directly by Councils, and another 2.6 million homes run by Social Housing providers with close links to Local Authorities. While sharing your problems with your landlord does have its own issues, social housing tenants do often have clear awareness and regular contact with people from a Local Authority.
Parents — while many more schools are now Academies, and so are directly funded and accountable to the Secretary of State for Education (not the Local Authority), Councils still have clear responsibilities for education and wellbeing of children at schools in their patch, and so often have more frequent interaction with parents of children of school age.
Does this match people who need support?
Clearly, these groups of people who fall in the Council streetlight generally have higher needs than the wider population. So any new programme looking to tackle poverty, food insecurity, unemployment etc, wouldn’t be going completely awry by focusing on these groups. However, if there are people outside these groups that still really do need support, it can be easy for Councils to miss or struggle to reach them.
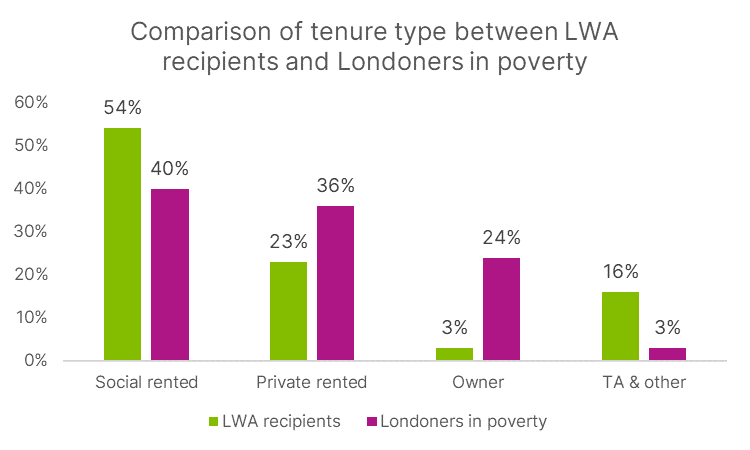
Part of the challenge is finding out whether this is actually a real problem. Fortunately, Policy in Practice released a great report earlier this year, showcasing this issue very clearly in the provision of Local Welfare Assistance (LWA), a fund managed by councils to help people facing financial difficulty. They did this by comparing the recipients of LWA to Trust for London’s London Poverty Profile.
As a fund targeting residents in poverty, you might expect the distribution of LWA to align with the percentage of people in poverty, across various different categories. But it doesn't, because of this streetlight effect.
Recipients of LWA were significantly more likely to be in those 4 groups with regular contact with their Council:
Social Housing Tenants:
Parents:
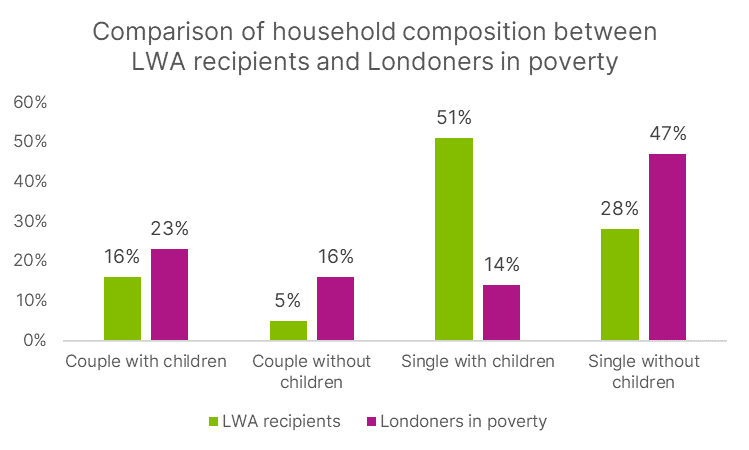
People on benefits:
This group is often deliberately over-represented, with many LWA schemes excluding residents not in receipt of means-tested benefits.
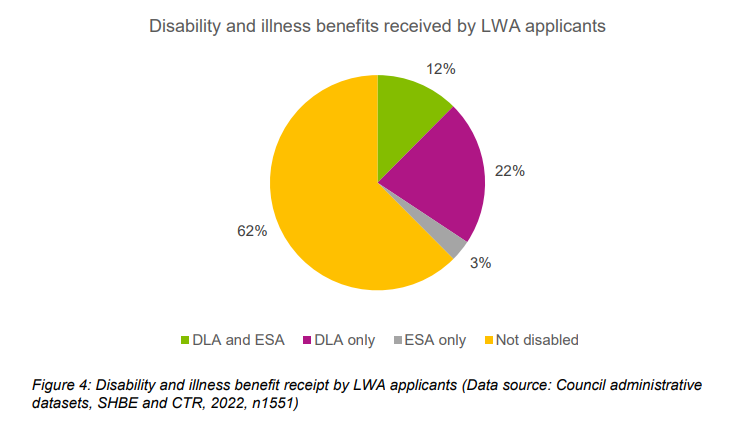
People with disabilities:
It’s not quite as clear if this group is overrepresented in LWA recipients (Trust for London don’t share statistics on the proportion of people in poverty that have disabilities), but the share of recipients is definitely very high:
This section of the report concludes that
The profile of LWA recipients also indicates that some households in need of crisis support may not be able to access this support or are underrepresented.
So this does seem like a real problem. As a Council, what could you do to solve it?
What if you could find some torches?
There are always going to be people that have less close contact with a Council. That’s not something any amount of outreach or advertisement of particular programmes can solve.
Many Councils have found that working with local Voluntary and Community organisations can help to broaden their reach, and shine a spotlight onto a different group of people.
Whether it’s through different opening times, being located in a different physical place, better connections with people with different first languages, or just because of different motivations to visit a community organisation, the members or beneficiaries of these organisations are likely to be different demographics to those in most close contact with a Council.
However, each individual organisation almost certainly has contact with a smaller number of people that the Council as a whole, so this needs to be something that is done across a network of different VCS organisations, in a way that doesn’t cause immense extra administrative burden to everyone involved.
Councils need to be better at understanding which VCS organisations are most effective at reach particularly demographics, for particular types of support. Outreach has to be targeted and focused, otherwise it gets lost in the noise.
Which torch should you buy?
I’m very aware I’m torturing this analogy, but let’s keep going for one more…
They key part about working with VCS groups to improve outreach as a Council isn’t necessarily about the number of people they work with, it’s about how this differs from the groups of people who know about your support already.
It’s similar to building a balanced investment portfolio. You want a diverse selection of investments that are not correlated with each other. Similarly, you should be prioritising VCS groups that work more with the people who are under-represented in Council programmes (i.e. for LWA, single people in private accommodation).
However, working out which VCS organisations work with the most different groups of people can be extremely difficult. Often community organisations struggle to collect the kind of information you would need to know to discover this, and if they do collect it, it’s often in a format that can be very difficult to analyse or extract.
How can we help?
At Plinth, as part of the Challenge London innovation programme funded by the Greater London Authority, we’re prototyping a data tool that will allow you to do exactly that, in real-time.
It will enable you to work with VCS partners to securely collect information about the people they work with on an ongoing basis, and then compare this constantly updating “population” with the groups of people you have been supporting through things like Household Support Funds (HSF) or Council Tax Benefit.
This could be done either directly (by pseudonymously comparing households on each list), or at an aggregate level by comparing the share of people in each population and analysing the differences.
We’ve been putting together some very basic, rough mock-ups of the kinds of outputs you could gain from this process.
Suppose you want to compare the people who applied for a Household Support Fund with the people attending a group of food banks in your area.
You might want to look at differences in household size:
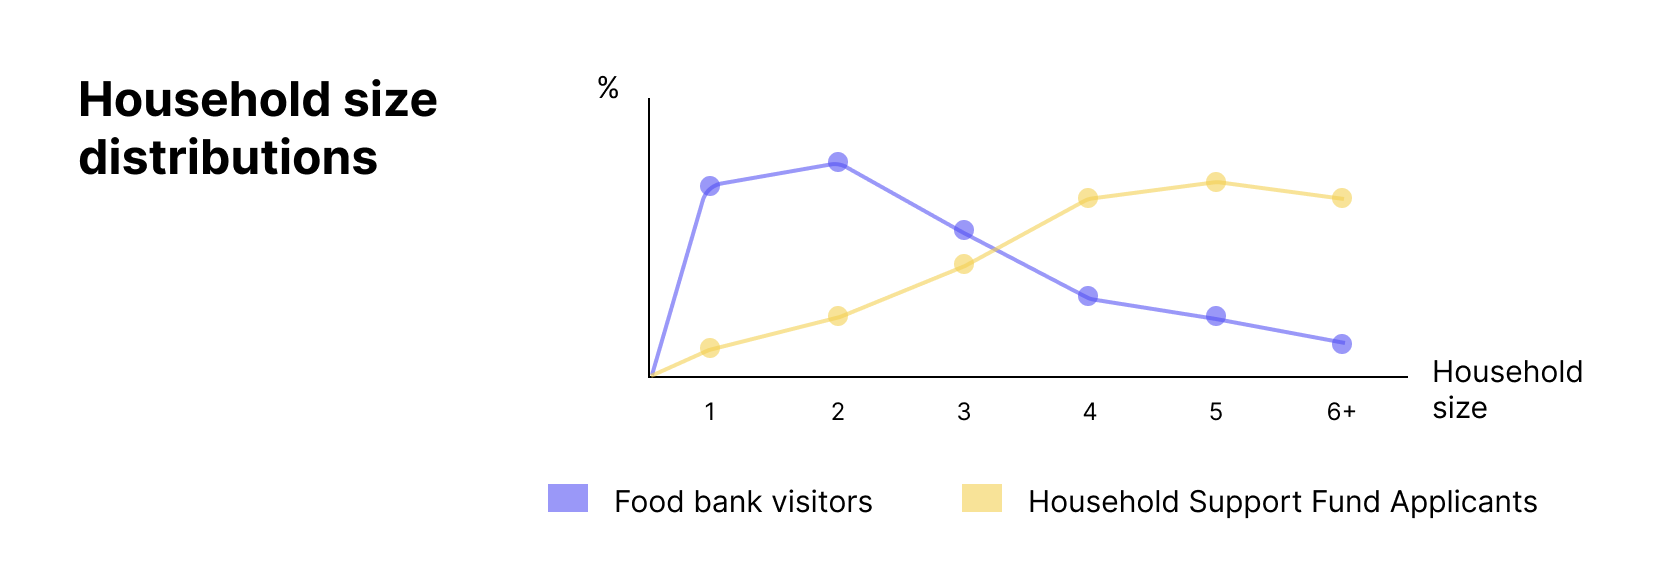
If you saw a graph like this, you’d know that working more closely with these food banks might help to increase your reach with single people.
Or if you wanted to reach different age brackets:
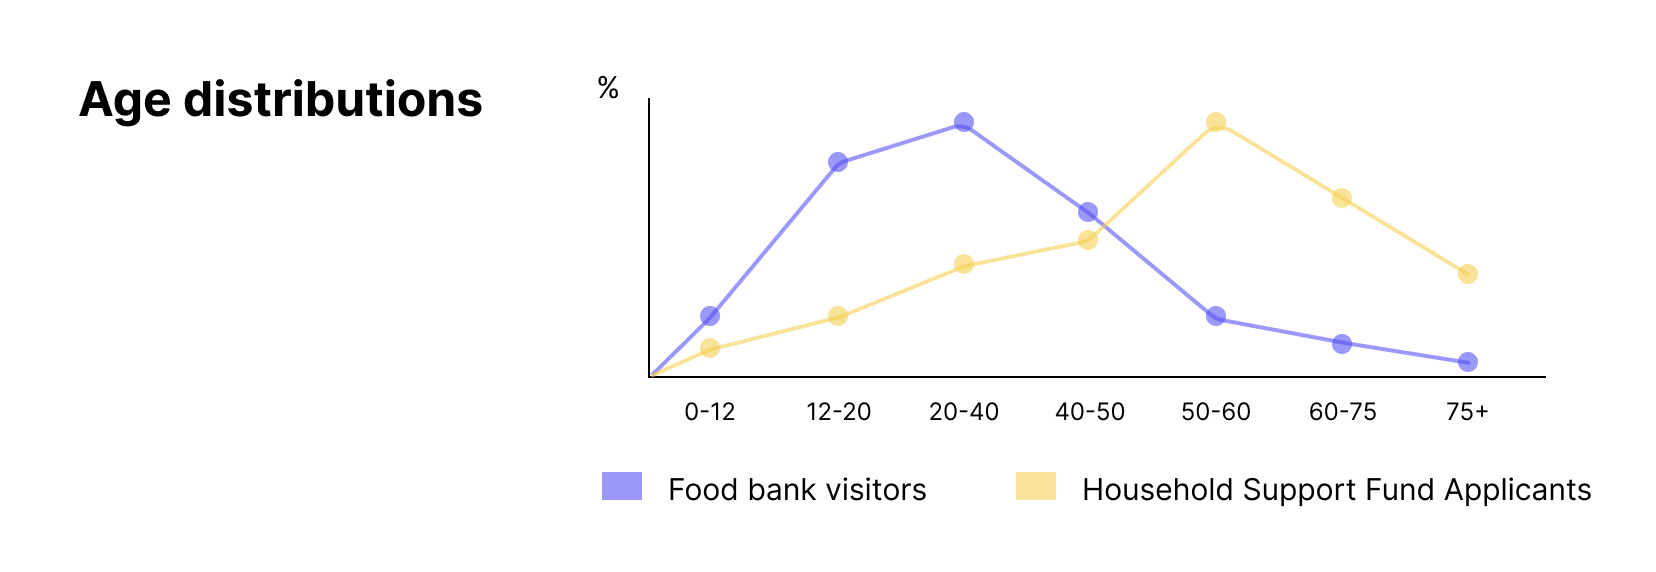
This graph might show you that while you’re doing a good job reaching older people (who might be more likely to be involved with Adult Social Care), you’re struggling to reach younger people.
Or perhaps there’s something similar with the tenure type of applicants:
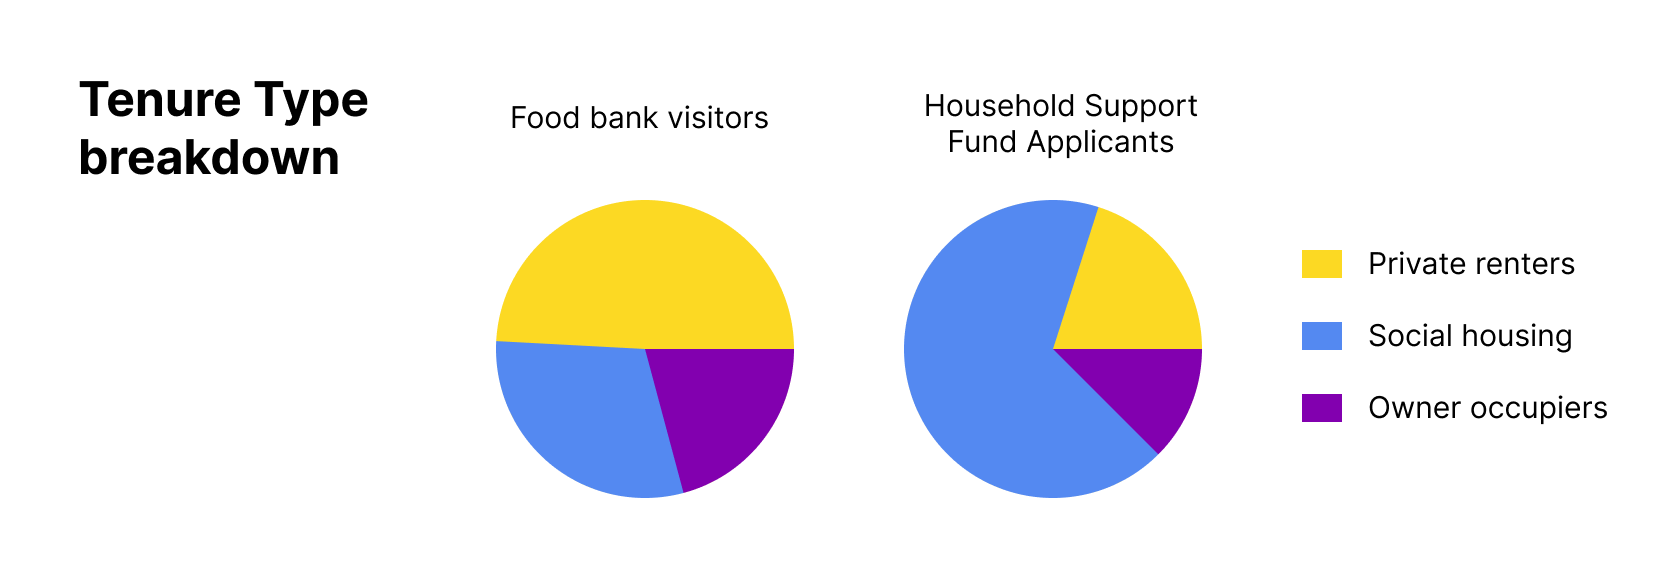
This could show you that a food bank visitor is more likely to be a private renter.
Ideally, you could do this analysis with different groups of people — different populations of interest from within the Council, but also people interacting with your VCS organisations in different ways (e.g. food bank visitors vs youth club parents vs community garden members).
Even more interestingly (though obviously much more difficult from a data cleanliness and an information governance perspective), we should be able to match the actual populations. So you can see the number of people who are attending a food bank, but didn’t receive a Household Support Fund, or vice versa.
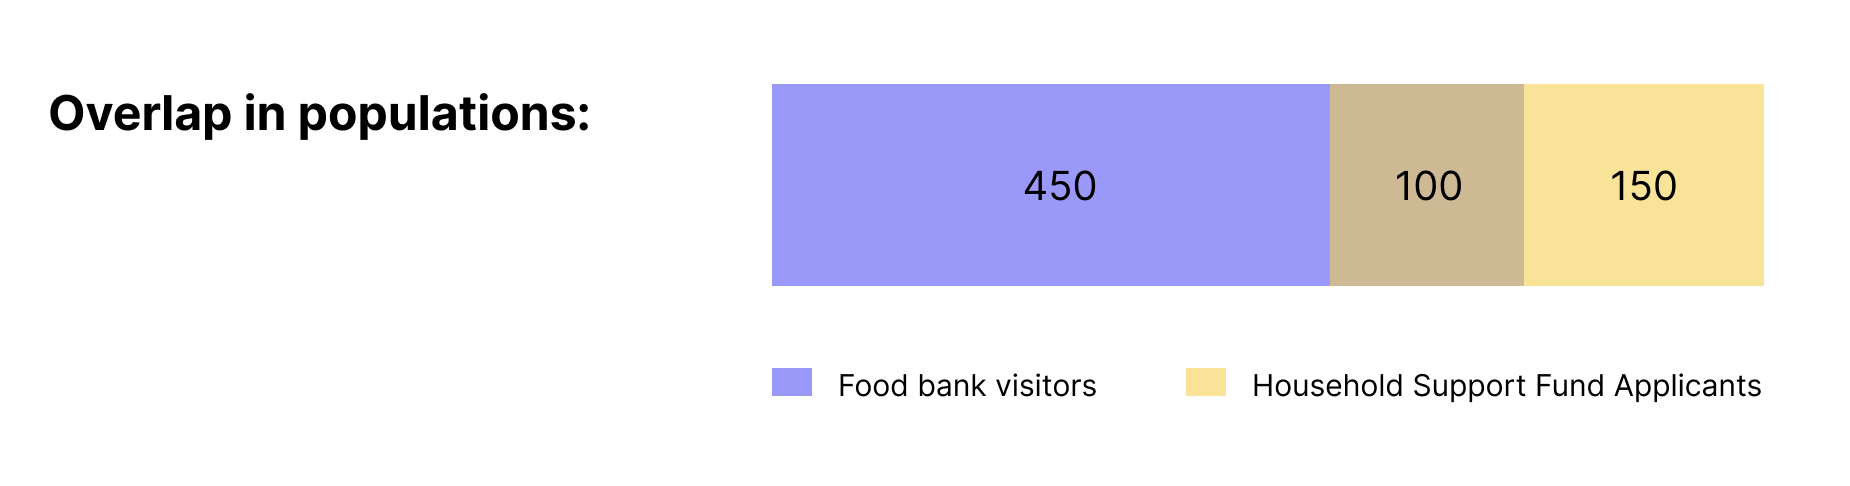
For example, if you saw this graph, you could tell that while there is some overlap between your HSF applicants and food bank visitors, there are 450 people who have needed a food bank, but haven’t applied for the HSF. This could help you prioritise the outreach to the particular organisations working with these people. This obviously needs personal data to match the two groups, but could all be done without revealing this personal information to the Council or to the VCS organisations.
We’d really like to get more feedback on what would be most valuable, but also how we can do this in a secure, GDPR compliant way that also reflects some very real issues over trust in data sharing.
If you work in a community organisation or a Council and would like to discuss this further, please get in touch with us! We’re on data@plinth.org.uk.